Is it your New Year’s resolution to improve inventory counting processes? We are here to help! Below you will find PULSE Dashboard reports for more accurate physical/cycle inventory counting.
The reports shown below were developed using the standard Physical Inventory Count report as well as custom reports using the Query Analyzer and Advanced Screen Designer features of the PULSE Designer Module.
Prior Year Variances Report
This standard report allows you to pinpoint inventory items that consistently result in large quantity or dollar variances (ex. 90% or higher) over the past X years. For example, most companies have a handful of items that cause large variances year after year. This report pinpoints those items so you can pre-count as well as double-count them.

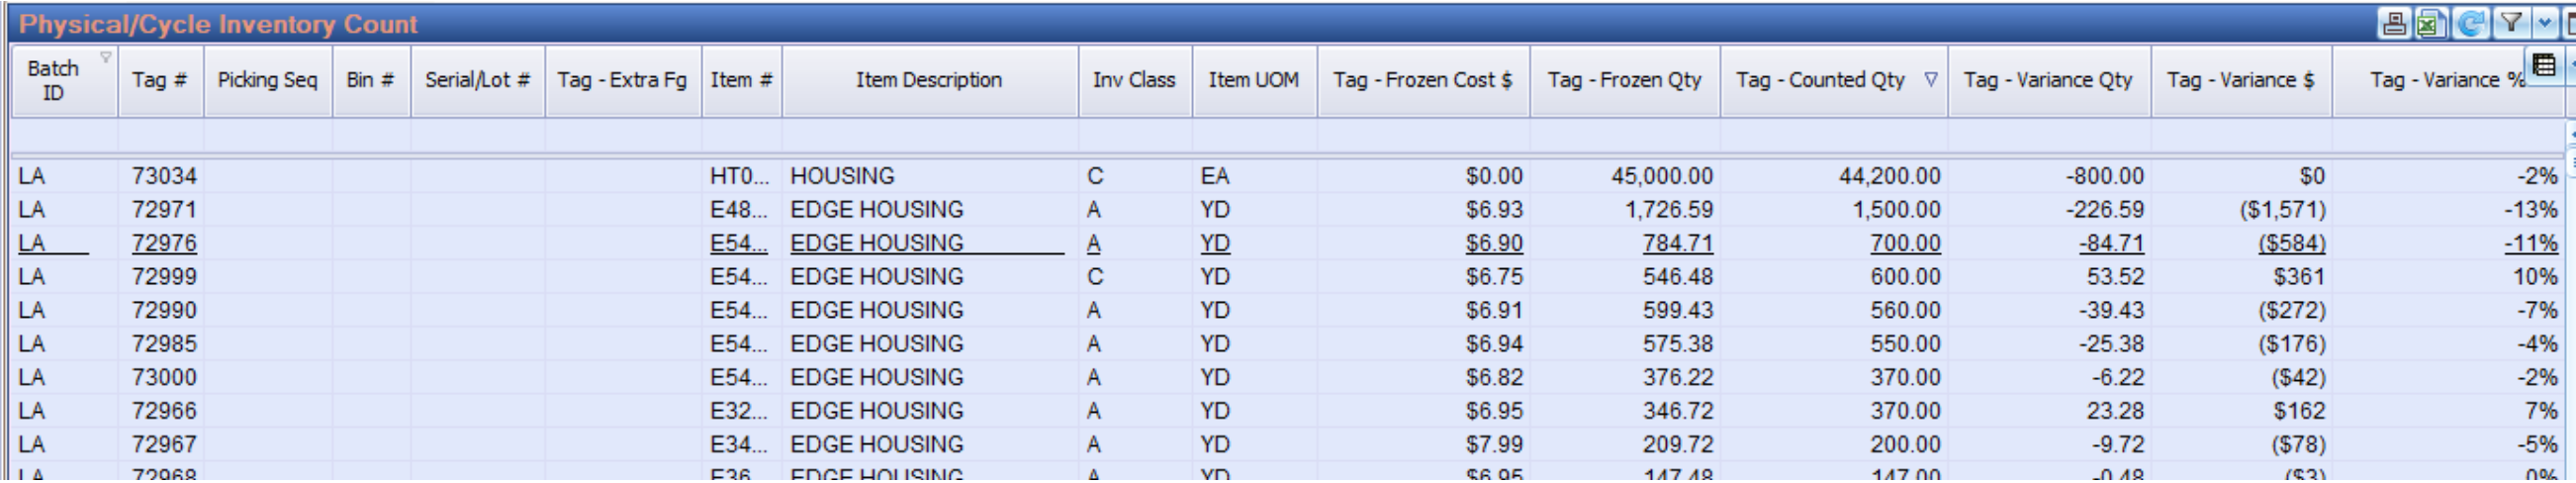
Physical/Cycle Inventory Count and Variance Report
This standard PULSE report allows you to track the counts by tags number, by bin number, by serial#/Lot#, picking sequence, etc. This report is intended to allow you to better track tag variances. For example, if your frozen quantity is 1,000 and the tag count was only 45, you may want to request a re-count. This is your dashboard for monitoring counts real-time.
NOTE: This report is NOT designed to give you a total variance by item. That is, it does not add up all counts by item versus the frozen quantity for that item. The Items Not Counted report (see below) gives you the most accurate overall variance dollar amount.
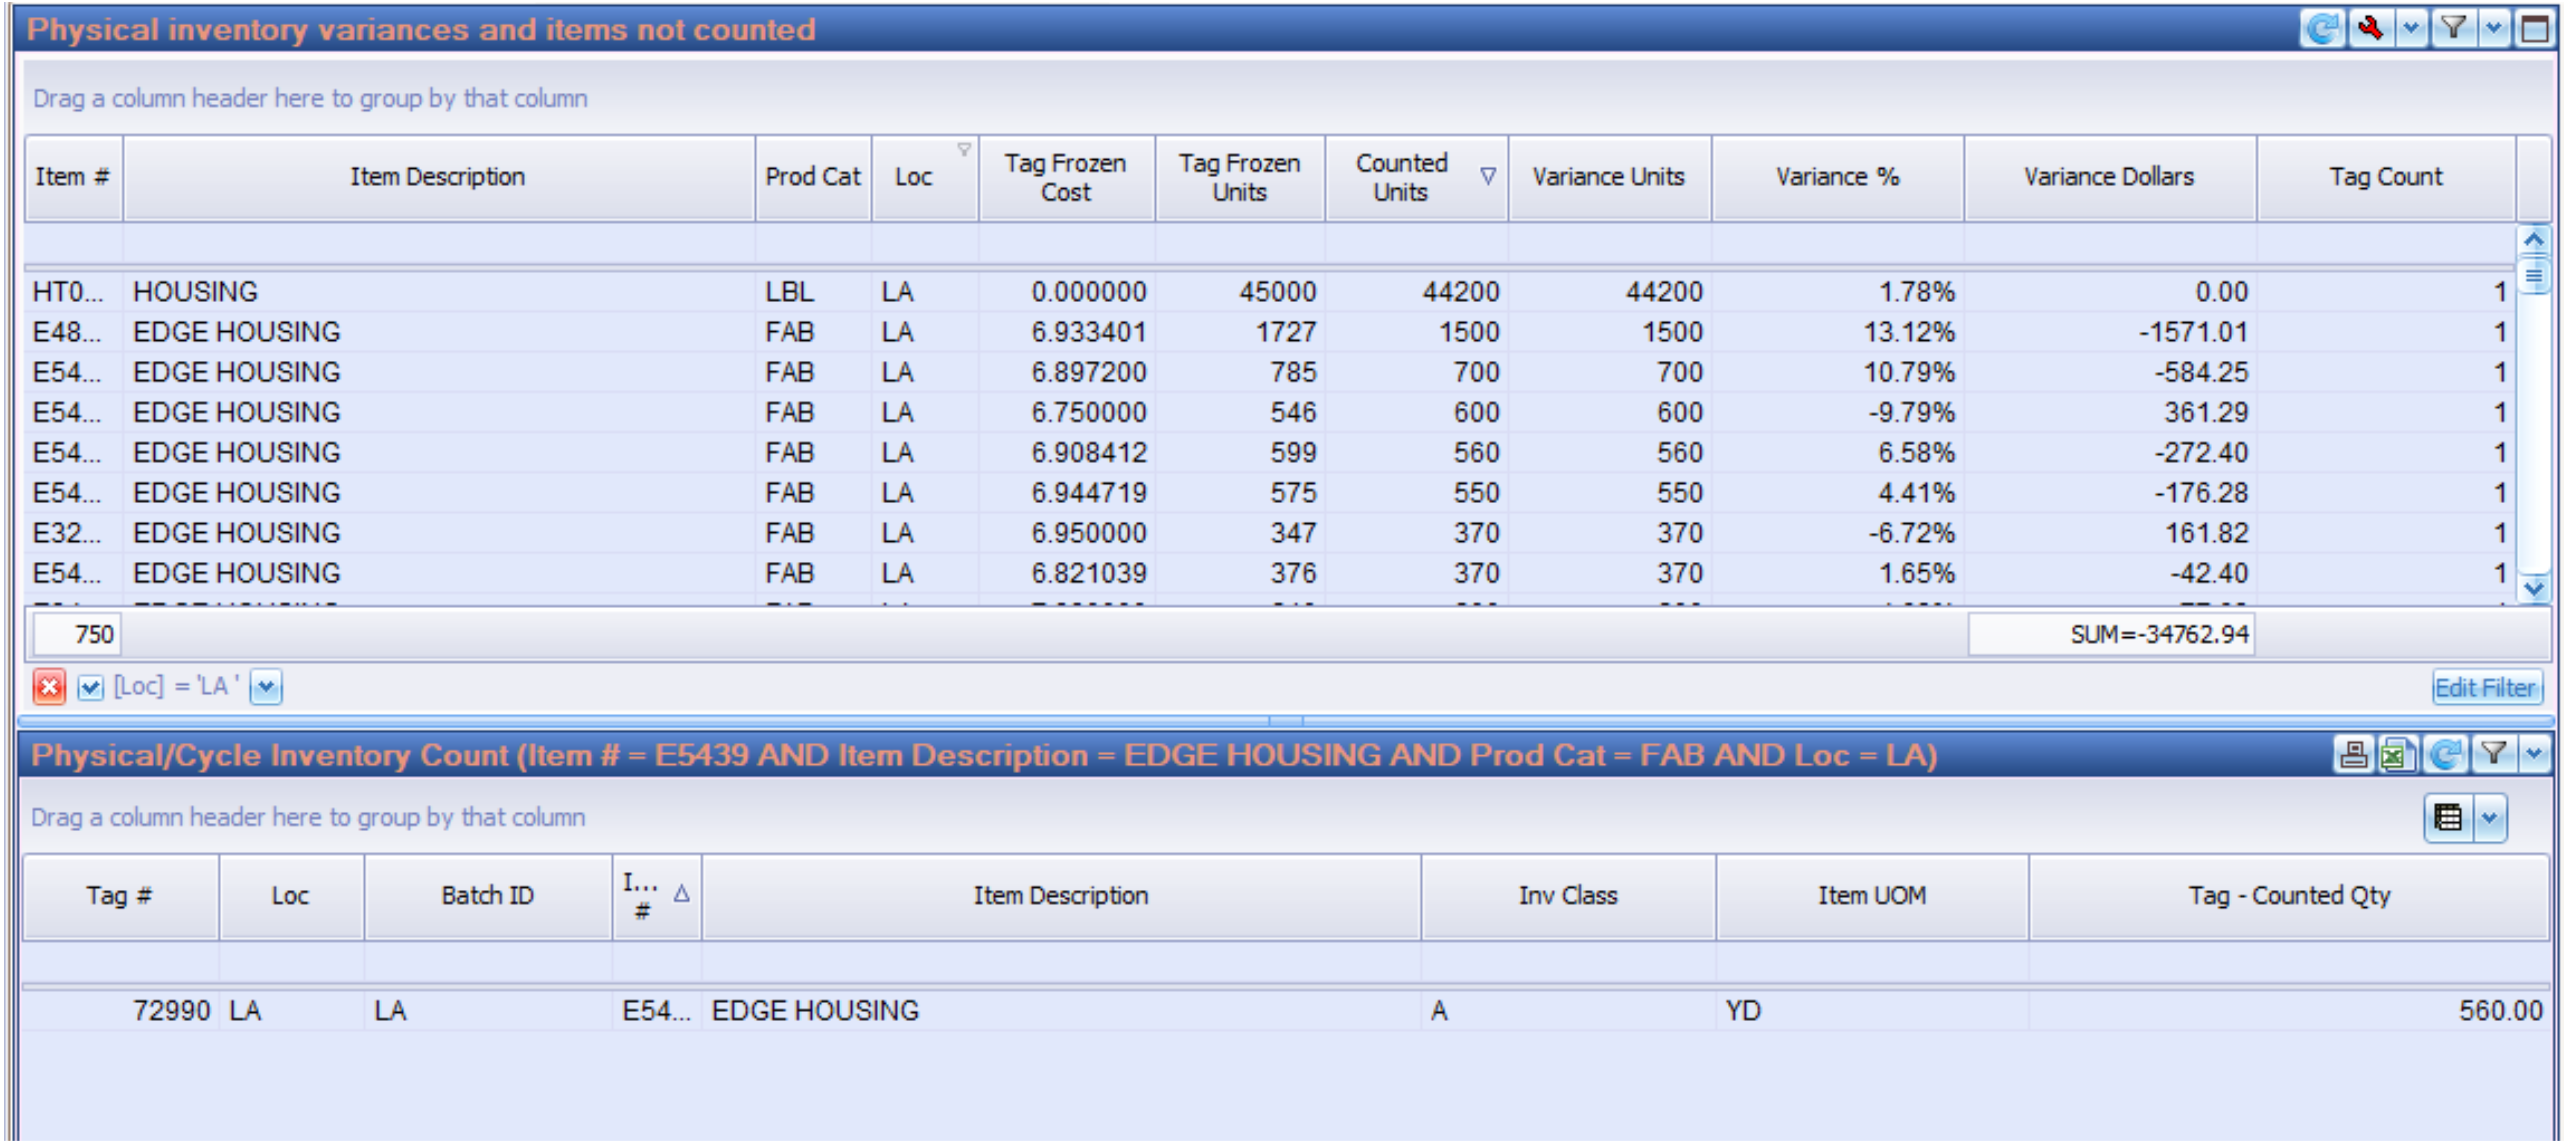
Physical/Cycle Count Variance and Items Not Counted Report
This custom report has two purposes:
For more information on the above PULSE Dashboard reports or to schedule a demonstration, contact us today!