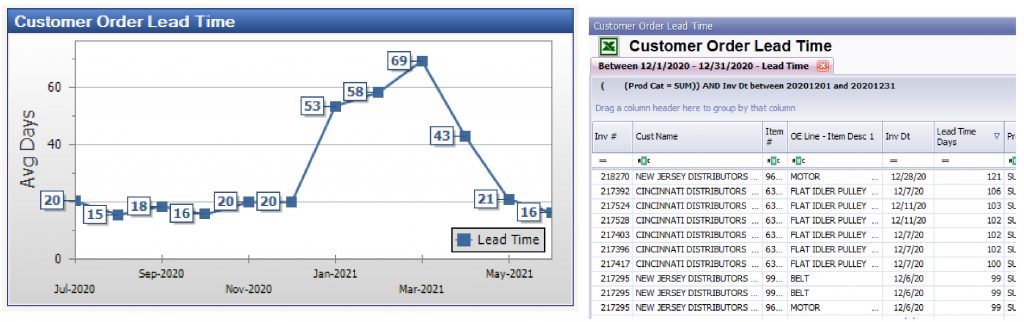
Every company has the goal of reducing the number of days it takes to process customer orders. But first, you need to know how long it is currently taking.
Below is a NEW standard graph within our PULSE Dashboard & Analysis software version 5.66. This real-time graph displays your results by month, by product category, by customer, etc. It also offers drill-down to view the details.
Customer Order Lead Time
We Want Your Feedback
If you are interested in enhancing this new graph for your operation, please contact us to share your feedback.